Please, no facts and numbers — I’m enjoying my opinion!
majwilsonlion on
What was “fixed” compared to the other recently posted graph. Clearly the results are different. Was the first one not using correct or recent data?
Final-Breadfruit2241 on
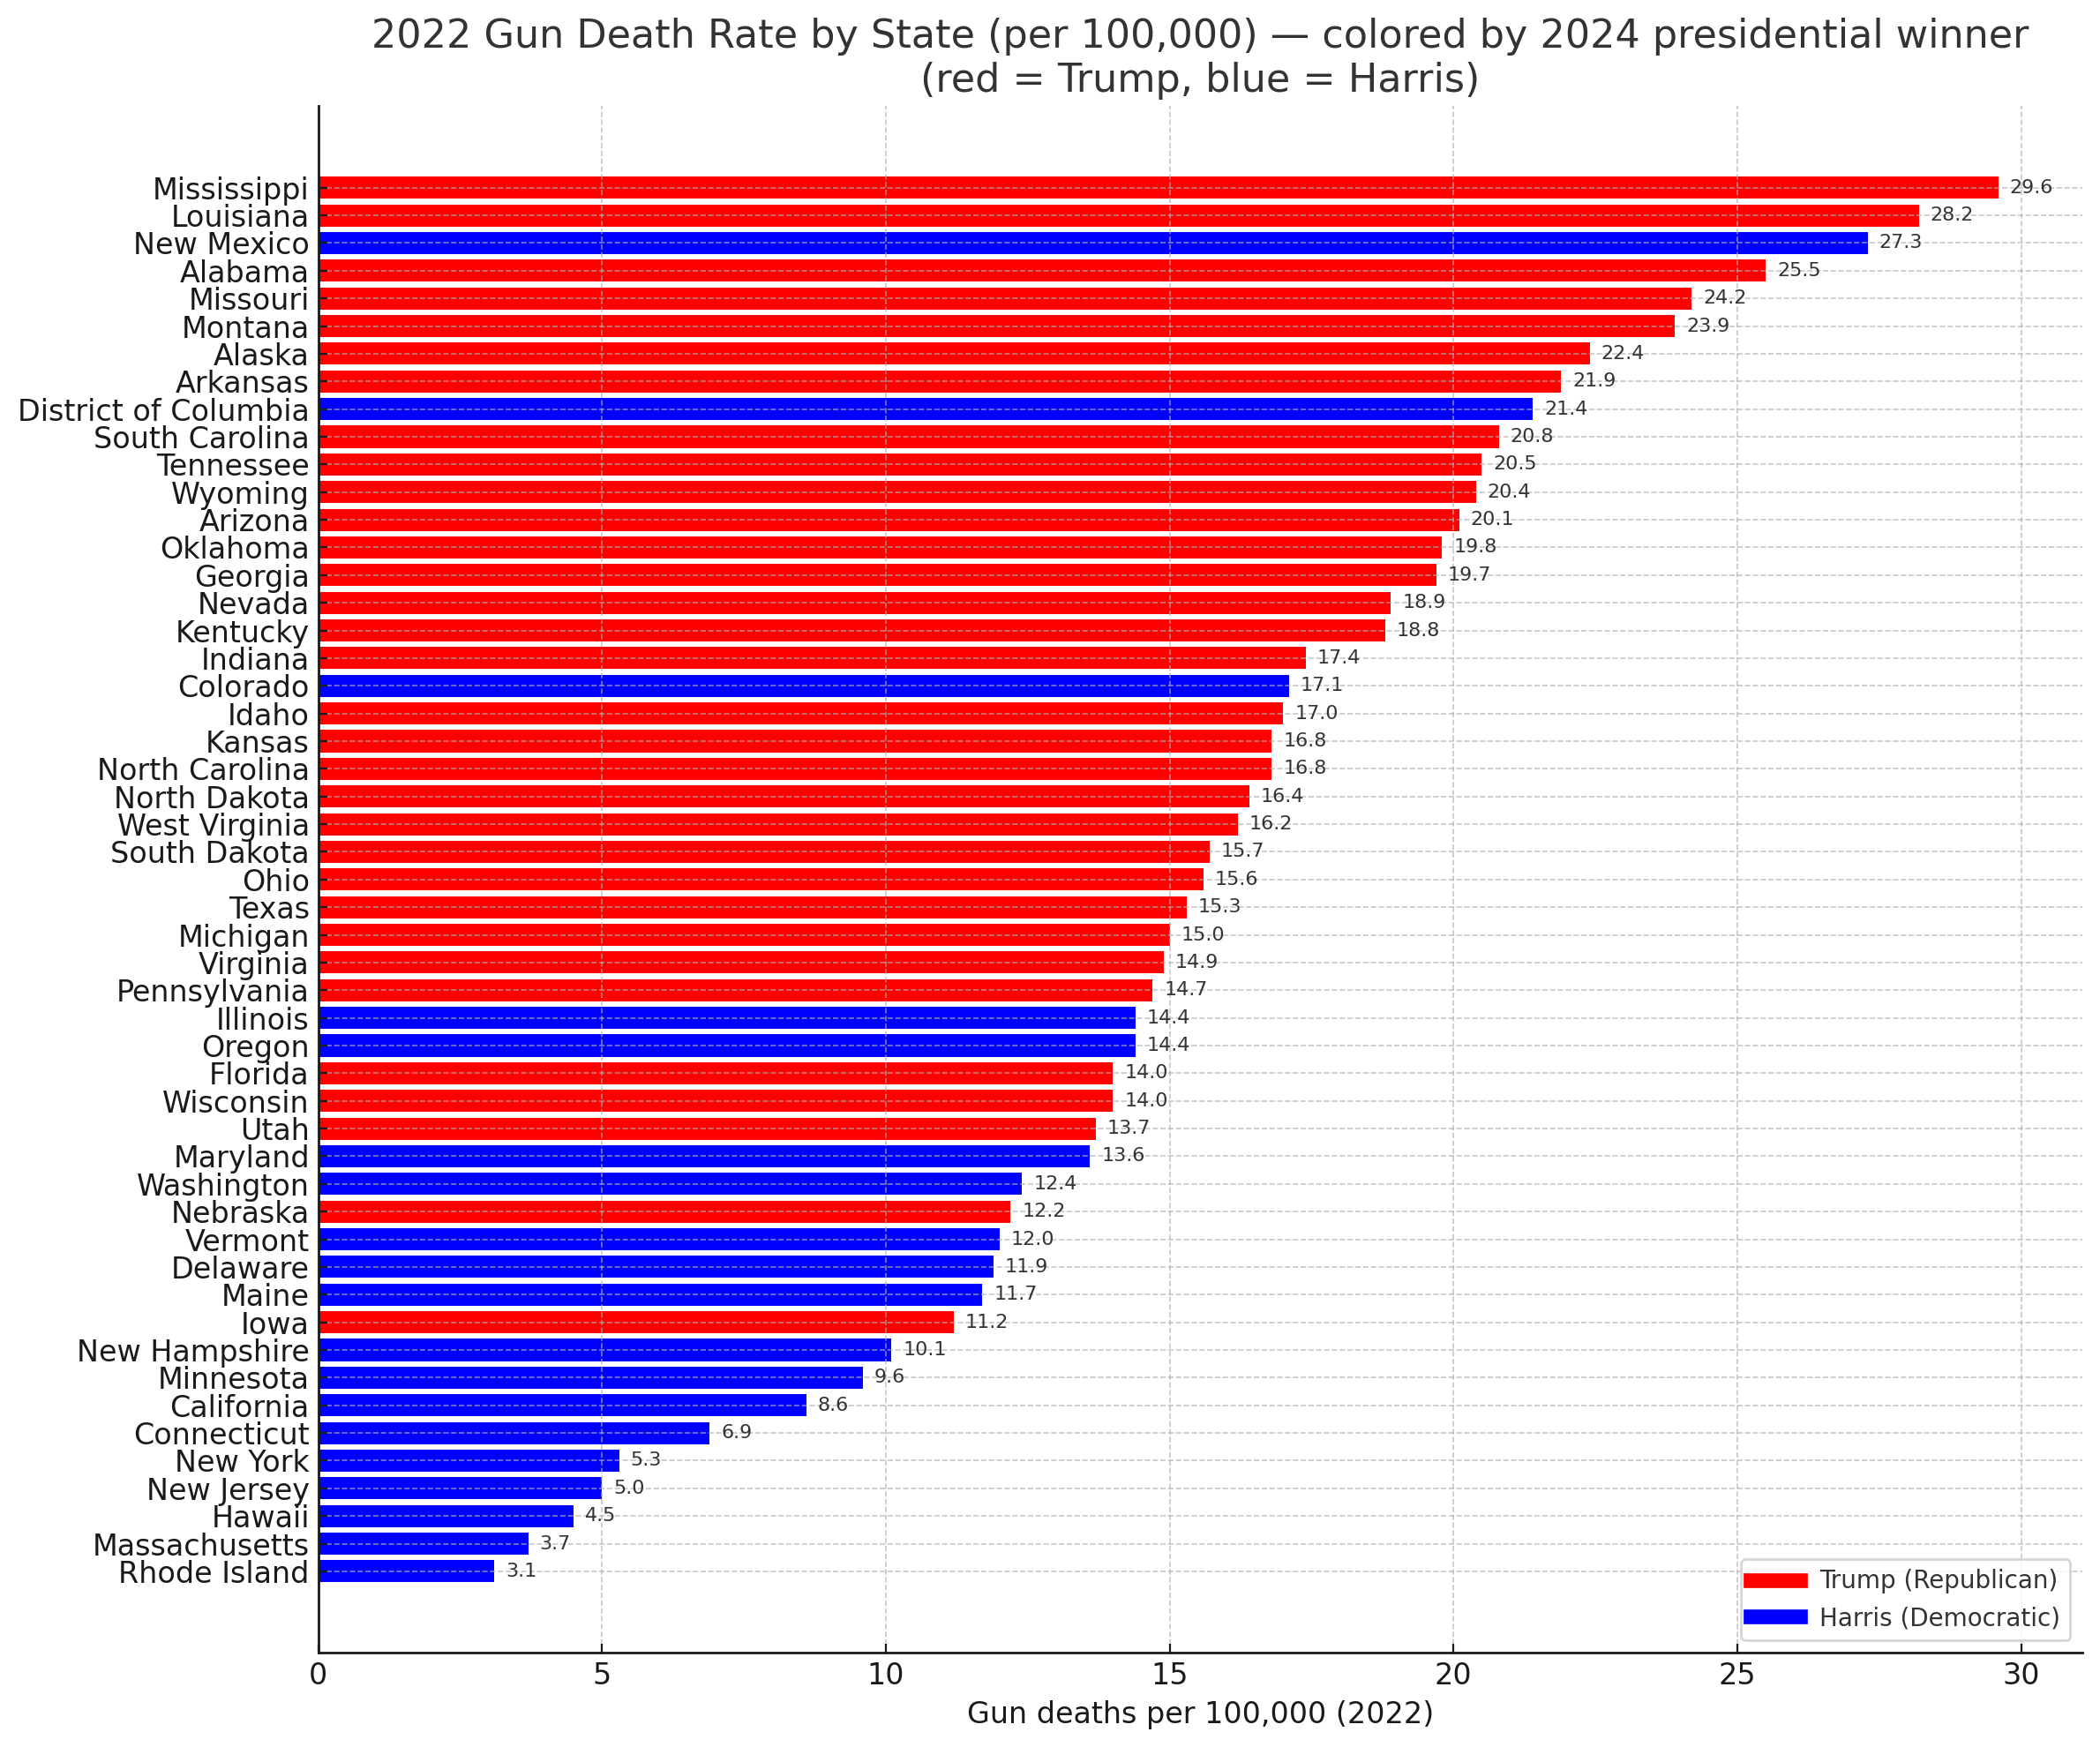
Did not expect to see Illinois so far down, or tied with Oregon of all places…
Wick0158 on
I wish this was a 3-5 year period or we had individual charts for other years.
triodoubledouble on
Where Canada would fit in ?
but_my_feelz on
Do it by city you cowards
aljerv on
No wonder red states think everything is shit.
Major projection
SiPhoenix on
By county rather than state is much more interesting.
chubbytitties on
Curious to see without suicides included
dirtyethanol73 on
Per 100k is always odd with populations. In 2022 there was 160 guns deaths in Alaska (less than .5 a day) and 666 in Arkansas (almost 2 a day). Six times as many but right next to each other on the list.
Over 1000 in New York State but a significantly higher population, so they appear low on this list.
I don’t care about any narratives about red vs blue, just shows how statistics can be visually skewed.
lettercrank on
Why bother colour coding by election winner? Seems like other factor beyond politics would be at play here- like socioeconomics
beekoffee on
Any way to make this graph interactive? Would love to slice the data by different variables — such as physical size of state of state x population of state, or registered gun owners x population.
I bet it’d be damning.
Release the epstonk fyles
No_Instance4233 on
Lotsa suicides on this graph, I’d like to see violent crime related gun deaths specifically.
EditorResponsible240 on
kinda wild detail: new mexico + alaska are blue on this map but their gun death rates look like deep south levels. it’s not really politics tho – more about poverty, rural life, and a ton of suicides driving the numbers up
n6n43h1x on
Just for context the homicide rate here in germany in 2024 was 0,9 per 100.000.
sonofchocula on
Mississippi is such a dump. They deserve Tate Reeves.
tombradythegoat12 on
Soooo gun violence is a completely overstated issue since 30 people out of 100,000 is nothing and natural rate?
Phyllostchys on
Virginia is wrong it should be blue in any case, but if you’re going to use 2022 gun data shouldn’t you use the 2020 election since a lot of the swing states would be considered blue at the time.
I also think this isn’t all that useful if you want to make a statement about gun policy. It would be better to do more of a scatter plot of gun deaths against poverty to see if being democratic makes more of difference than the poverty.
“In 2019-20, there were 199 registered deaths related to firearms in Australia, including all injury types (suicides, assaults, undetermined intent)…Suicide accounted for 79.8% of the firearm-related deaths in 2019-20, with homicide accounting for 13.5%. There were 3 deaths (1.5%) recorded as unintentional (i.e., accidental discharge of firearms). The remainder were of undetermined intent (10 deaths, 5%).”
We have a similar rate of non-gun homicides to the US, and a similar non-gun suicide rate.
daveyhempton on
People fighting over blue and red states/cities in the comments here when the real problem has always been the ruling class making us hate each other over literally everything so they can fuck us every which way while we’re distracted
Great_Revolution_276 on
Australia = 0.9 per 100,000 in 2022/23.
Decent gun laws might actually be a good thing surprisingly…
coldfarnorth on
Thank you for posting this! I did a similar chart a while back, and the comments were pretty much exactly the same.
ibpositiv on
United States of embarrassment
Randomcentralist2a on
Remove suicide and redo it.
Sythriox on
This just shows the tool, not the act. Ststes with more guns, use that tool. If they didnt have guns, there would be another tool used. That, and suicide accounts for most for this, and that is generally based on being poor. A homicide per capita map is not black and white like this. 90% of gun related deaths in idaho are suicide. Idaho and much of the Midwest has lower homicide rates than the coastal states. You would be 3x more likely to be murdered in california than in Idaho or Utah, and thats with all their gun control.
This sums up to poor states vote red, rich states vote blue. Essentially class warfare, where poor states don’t feel served by the government. Taxes effect them more, and outsourcing industry kills landlocked states (or poorly positioned coastal ones). Coastal cities import and export services. Being a blue state doesn’t make you rich, as it’s more geographically based. More like being a rich bourgeois makes you vote blue, funny enough.
Of course there are countless other factors, such as racial demographics, whether a red state has a major blue city, etc. This data just shows the tool, not the acts. Guns are more common, and are therefore used more.
Queasy-Suit4400 on
This is going to be driven by stuff other than politics. Its more of A and B are correlated not because A causes B, but because C causes both A and B. Also know as a spurious correlation.
Gun deaths are more driven by stuff like demographics (ie race), and gun ownship rates (people are more likely to die from guns if they own them)
saint_geser on
This is misleading and using partisan politics to misrepresent data. Did 100% of the population of Missouri vote for Trump?
Equal_Abroad_2569 on
Virginia didn’t go to Trump!
wouldashoudacoulda on
Interestingly, Australia is 0.9, over three times lower than the lowest American state.
spenzerrbencer on
So you’re telling me states with high gun deaths in 2022 voted for the party that doesn’t support dismantling the police in 2024?
Woah shocking.
v32010 on
*A lot* of people are trying to pin this on blue vs red but gun deaths really aren’t due to either party.
BunRabbit on
Now show all the other countries in the G20.
chameltoeaus on
Yes but repeat that will the full context. (no dont, because that’ll just make it even worse)
0bfuscatory on
Yet Trump is focusing on blue state crime.
ThinkingOz on
I googled Australia’s equivalent rate and AI tells me it’s 0.9 (estimate) . I know where I’d rather live.

36 Comments
There’s a trend I’m almost noticing
Please, no facts and numbers — I’m enjoying my opinion!
What was “fixed” compared to the other recently posted graph. Clearly the results are different. Was the first one not using correct or recent data?
Did not expect to see Illinois so far down, or tied with Oregon of all places…
I wish this was a 3-5 year period or we had individual charts for other years.
Where Canada would fit in ?
Do it by city you cowards
No wonder red states think everything is shit.
Major projection
By county rather than state is much more interesting.
Curious to see without suicides included
Per 100k is always odd with populations. In 2022 there was 160 guns deaths in Alaska (less than .5 a day) and 666 in Arkansas (almost 2 a day). Six times as many but right next to each other on the list.
Over 1000 in New York State but a significantly higher population, so they appear low on this list.
I don’t care about any narratives about red vs blue, just shows how statistics can be visually skewed.
Why bother colour coding by election winner? Seems like other factor beyond politics would be at play here- like socioeconomics
Any way to make this graph interactive? Would love to slice the data by different variables — such as physical size of state of state x population of state, or registered gun owners x population.
I bet it’d be damning.
Release the epstonk fyles
Lotsa suicides on this graph, I’d like to see violent crime related gun deaths specifically.
kinda wild detail: new mexico + alaska are blue on this map but their gun death rates look like deep south levels. it’s not really politics tho – more about poverty, rural life, and a ton of suicides driving the numbers up
Just for context the homicide rate here in germany in 2024 was 0,9 per 100.000.
Mississippi is such a dump. They deserve Tate Reeves.
Soooo gun violence is a completely overstated issue since 30 people out of 100,000 is nothing and natural rate?
Virginia is wrong it should be blue in any case, but if you’re going to use 2022 gun data shouldn’t you use the 2020 election since a lot of the swing states would be considered blue at the time.
I also think this isn’t all that useful if you want to make a statement about gun policy. It would be better to do more of a scatter plot of gun deaths against poverty to see if being democratic makes more of difference than the poverty.
Australia is below 1 on this measure, although the figures I found were [from 2019-20. ](https://www.phaa.net.au/common/Uploaded%20files/SIG%20documents/Injury%20Prevention%20SIG/PPS%202023/09-02_-_Injury_-_Firearms_Injury.pdf)
“In 2019-20, there were 199 registered deaths related to firearms in Australia, including all injury types (suicides, assaults, undetermined intent)…Suicide accounted for 79.8% of the firearm-related deaths in 2019-20, with homicide accounting for 13.5%. There were 3 deaths (1.5%) recorded as unintentional (i.e., accidental discharge of firearms). The remainder were of undetermined intent (10 deaths, 5%).”
We have a similar rate of non-gun homicides to the US, and a similar non-gun suicide rate.
People fighting over blue and red states/cities in the comments here when the real problem has always been the ruling class making us hate each other over literally everything so they can fuck us every which way while we’re distracted
Australia = 0.9 per 100,000 in 2022/23.
Decent gun laws might actually be a good thing surprisingly…
Thank you for posting this! I did a similar chart a while back, and the comments were pretty much exactly the same.
United States of embarrassment
Remove suicide and redo it.
This just shows the tool, not the act. Ststes with more guns, use that tool. If they didnt have guns, there would be another tool used. That, and suicide accounts for most for this, and that is generally based on being poor. A homicide per capita map is not black and white like this. 90% of gun related deaths in idaho are suicide. Idaho and much of the Midwest has lower homicide rates than the coastal states. You would be 3x more likely to be murdered in california than in Idaho or Utah, and thats with all their gun control.
This sums up to poor states vote red, rich states vote blue. Essentially class warfare, where poor states don’t feel served by the government. Taxes effect them more, and outsourcing industry kills landlocked states (or poorly positioned coastal ones). Coastal cities import and export services. Being a blue state doesn’t make you rich, as it’s more geographically based. More like being a rich bourgeois makes you vote blue, funny enough.
Of course there are countless other factors, such as racial demographics, whether a red state has a major blue city, etc. This data just shows the tool, not the acts. Guns are more common, and are therefore used more.
This is going to be driven by stuff other than politics. Its more of A and B are correlated not because A causes B, but because C causes both A and B. Also know as a spurious correlation.
Gun deaths are more driven by stuff like demographics (ie race), and gun ownship rates (people are more likely to die from guns if they own them)
This is misleading and using partisan politics to misrepresent data. Did 100% of the population of Missouri vote for Trump?
Virginia didn’t go to Trump!
Interestingly, Australia is 0.9, over three times lower than the lowest American state.
So you’re telling me states with high gun deaths in 2022 voted for the party that doesn’t support dismantling the police in 2024?
Woah shocking.
*A lot* of people are trying to pin this on blue vs red but gun deaths really aren’t due to either party.
Now show all the other countries in the G20.
Yes but repeat that will the full context. (no dont, because that’ll just make it even worse)
Yet Trump is focusing on blue state crime.
I googled Australia’s equivalent rate and AI tells me it’s 0.9 (estimate) . I know where I’d rather live.