
Graph from my blog, see link for full analysis: https://polimetrics.substack.com/p/business-sentiment-trends-september
Data from Census Business Trends and Outlook Survey. Claude used to make graph.
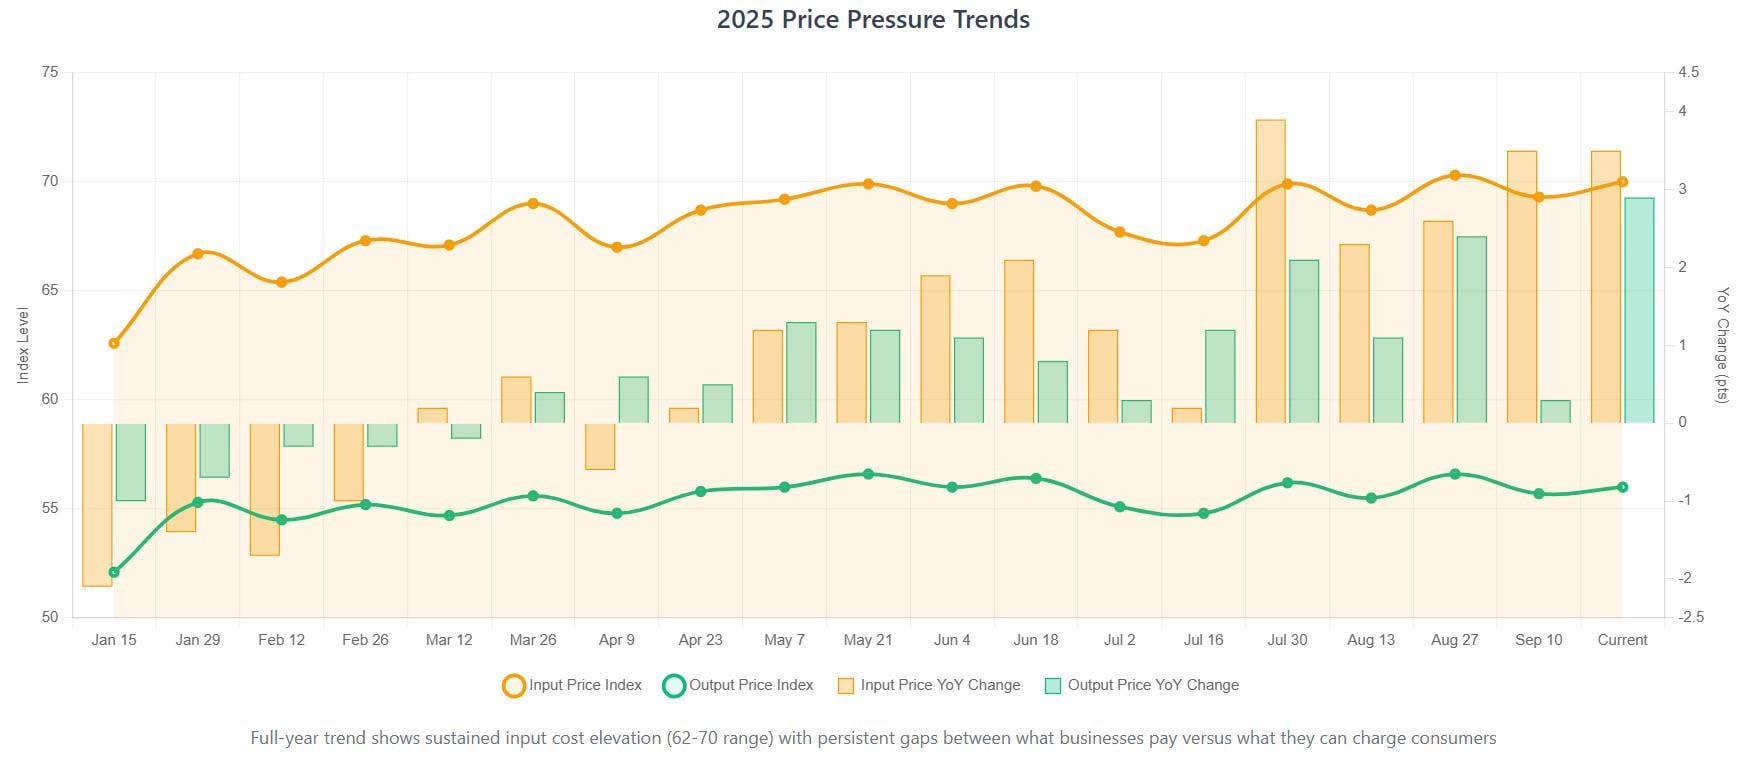
This graph shows increases in business input costs (prices they pay) and output costs (prices they charge consumers). An index score above 50 indicates an increase in prices while a score under 50 indicates a decrease.
Cost growth was below where it was in 2024 to start 2025, but since about April 2025 they have begun rising steadily for both. When comparing effective tariff rates, growth in tariff rates correlates strongly with growth in both price categories.
by Public_Finance_Guy