
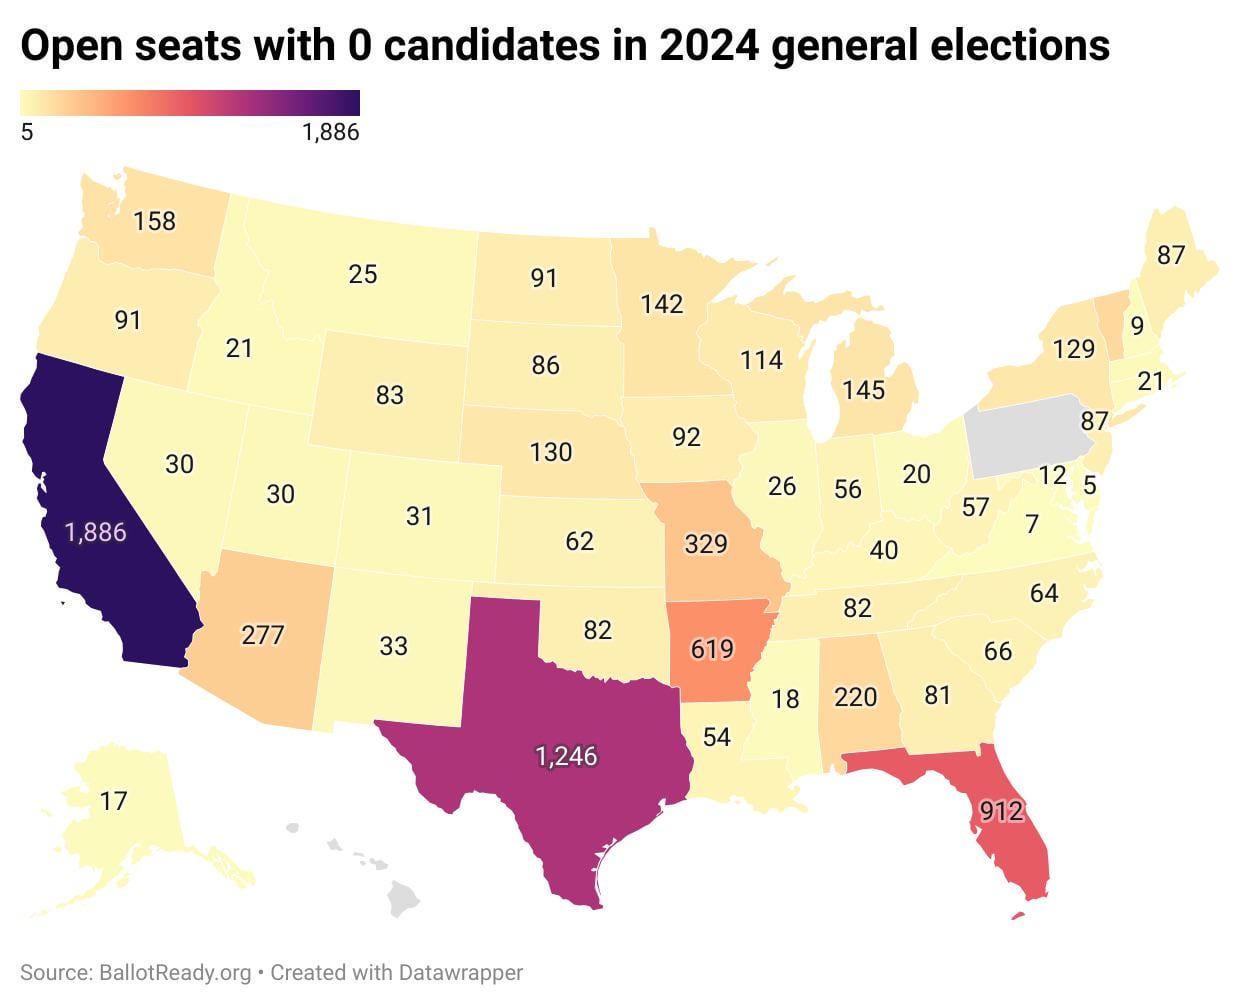
According to a report from BallotReady, nearly 10% of all positions up for office had 0 candidates appear on the ballot. In some cases, incumbents went unchallenged and elections were outright cancelled. In other cases, seats were filled by appointment instead or absorbed by other offices. Source: BallotReady, made with DataWrapper
by BallotReady
4 Comments
Total number of seats seems a bit meaningless. Wouldn’t this be better presented as a percentage of all seats contested.
“Open seats” makes it sound like the positions aren’t already filled… but then you say only in some cases do the incumbents go unchallenged. So for instance, 1886 in California, how many of those are already filled and how many are currently vacant with no one running?
For the 48 states with data, there is a 0.82 correlation between seats and population, so largely this is just a map of state populations. That said, I did also grab state populations, so here are the highest and lowest per 100,000 rates:
33.9 Vermont
20.0 Arkansas
14.1 Wyoming
11.4 North Dakota
9.3 South Dakota
6.5 Nebraska
6.2 Maine
5.3 Missouri
…
0.5 Colorado
0.5 Delaware
0.3 Massachusetts
0.2 Illinois
0.2 Maryland
0.2 Ohio
0.1 Virginia
The number labeling in the Northeast hardly counts as “beautiful”