We built a aggregate dataset containing over 3000 variables describing different facets of the Olympic Games year by year. We then calculated the correlation between all numerical columns to find some interesting relationships, and then selected the most visually appealing ones!

3 Comments
Hello everyone!
Inspired by [Tyler Vigen’s Spurious Correlations](https://www.tylervigen.com/spurious-correlations), which were posted here [a few days ago](https://www.reddit.com/r/dataisbeautiful/comments/1ad2uw3/oc_spurious_correlations_line_graphs_showing/), we set out to find startling and unsettling connections between different seemingly unrelated Olympic concepts for a visualization contest.
We built a aggregate dataset containing over 3000 variables describing different facets of the Olympic Games year by year. We then calculated the correlation between all numerical columns to find some interesting relationships, and then selected the most visually appealing ones!
The code and project walkthrough is available [on my Github](https://github.com/malcolmosh/correlympics).
Here are [**a few more cool graphs!**](https://imgur.com/a/VzNEwIv)
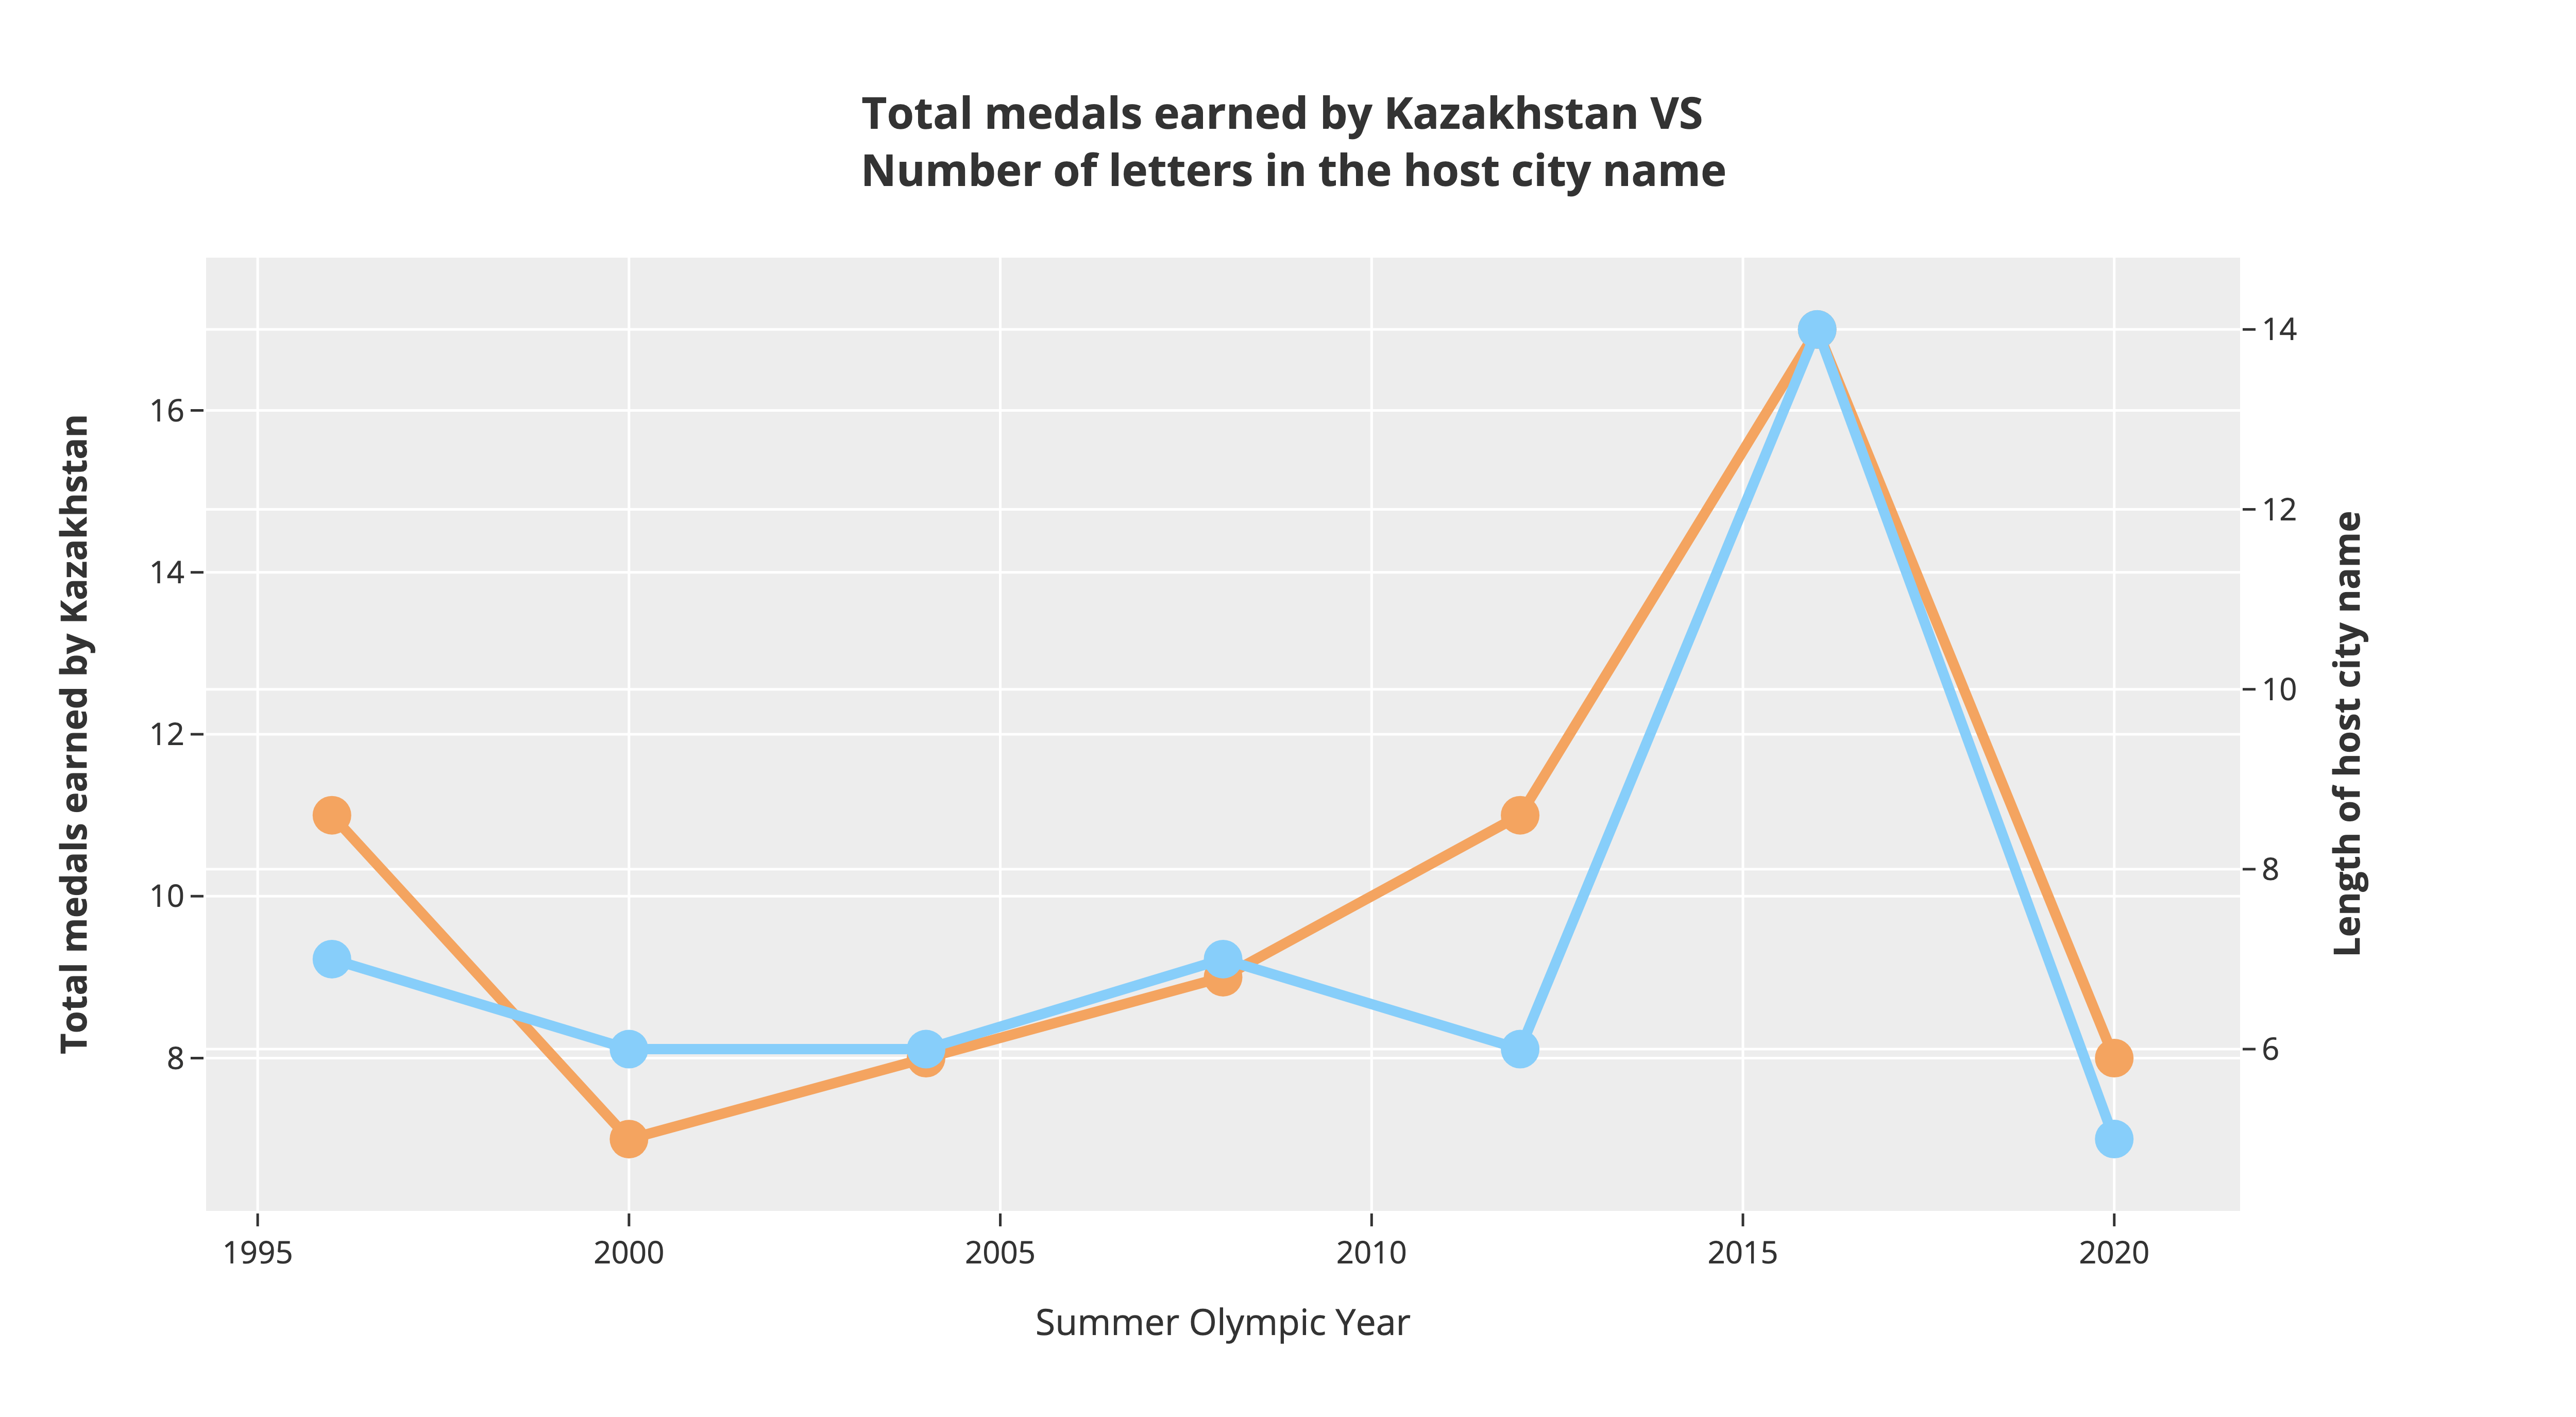
So if the olympics were ever held in Llanfairpwllgwyngyllgogerychwyrndrobwllllantysiliogogogoch Kazakhstan would be King, yeah?
It would be cleaner if you used the same y-axis scale for both datasets